This is 2nd edition of company research original research can be found here (https://www.shinichiroyano.com/2021/09/30/asx-whc-analysis-1st-ed2021-09-30/)
Whitehaven Coal is a coal mining and exploration company listed in ASX. The price on Friday, Aug.13th 2021 ended at 2.38 and on Thursday of Sept. 30th, 2021 ended at 3.23 and Nov. 10th ended at 2.48. The share of outstanding is 1.03B so that market capitalization is A$2.55B. The company sells high-quality coal products to the Asian market mainly Japan (55%), Taiwan (16%), Korea (15%) for thermal coal, India (48%), Japan (16%), Vietnam (12%), and Korea (11%) for Metallurgical Coal Sales in FY20. The company’s share price soars because coal is now the highest at least the last 10 years. I am not sure the coal price keeps at this level. The demand for coal surged after the COVID-19 restriction started lifting around the world. In early October, the coal price high an all-time high at 269USD/ton. At the writing in early November, it came back down to about 160 USD/ton. It is still high. Also, there are Chinese demands shrink because the Chinese mining companies are producing coal at a record level since the Chinese government is trying to ease the electricity crisis in China. However, Whitehaven is not selling its coal directly to China.
| FY20-1 (million) | FY20-2 (million) | FY21-1 (million) | FY21-2 (million) | |
| Revenue | 885.1 | 836.5 | 699.3 | 857.7 |
| EBITDA | 177.3 | 128.7 | 37.2 | 167.3 |
| NPAT | 27.4 | 2.6 | -94.5 | -449.4 |
| Dividend | 1.5 | 0 | 0 | 0 |
The company was having a hard time last the 4 half-year results because of the coal price. After the coal price came back, the price of the share has been rising. I believe the company will start making money from FY22 in the first half because of the high coal price. I could not see a big picture here so I checked at least 5 years of history as below.
| \A$m | FY17 | FY18 | FY19 | FY20 | FY21 |
| Revenue | 1,773.2 | 2,257.4 | 2,487.9 | 1,721.6 | 1557.0 |
| EBITDA(underlying)(*) | 714.2 | 1011.9 | 1041.7 | 306 | 204.5 |
| Net profit after tax | 405.4 | 524.5 | 564.9 | 30 | -543.9 |
| EPS (taken from WSJ) | 0.41 | 0.53 | 0.53 | 0.03 | -0.55 |
| Operating Cashflow (**) | 607.6 | 883.4 | 916.5 | 146.4 | 138.8 |
| Net debt | 311.1 | 270.4 | 161.5 | 787.5 | 808.5 |
| Dividend (cents) | 6 | 40 | 50 | 1.5 | 0 |
Surprisingly, on the day of releasing FY21 results, the share price rose 4.95%. I believe the investor understood this NPAT is the worst last 5 years because of the A$650m impairment of their asset. Revenue went down last two financial years it is because the coal price was low. I will show you later but the coal production does not change much last 5 years. In the last 5 years, FY18 and FY19 they had good NPAT but now the coal price is much higher since the beginning of FY22.
(*)I tried to find information from the company’s financial report but I saw some inconsistency. (**)I took data from the company’s financial report and the WSJ website.
| \A$m | FY17 | FY18 | FY19 | FY20 | FY21 | FY22Sept |
| Unit cost/ton $Am | 58 | 58(62)(***) | 67 | 75 | 74 | |
| Realized thermal coal Prices USD/t | 81 | 98 | 100 | 66 | 68 | 142 |
| Matellgurical USD/t | 102 | 119 | 119 | 89 | 85 | 134 |
| ROM coal production Mt | 23.1 | 23.0 | 23.2 | 20.7 | 20.7 | 5.16 |
| Sales Mt | 20.7 | 22.1 | 21.6 | 20.2 | 19.8 | 4.64 |
| Thermal coal (Mt) | 16.2 | 16.1 | 17.5 | 17.2 | 17.2 | |
| Metallurgical coal (Mt) | 4.4 | 6.0(****) | 4.1 | 3.0 | 2.6 | |
| 0.75 | 0.78 | 0.72 | 0.67 | 0.74 |
I have updated the information based on the last quarterly report. Both types of coal prices are up.
I have tried to calculate some here. The coal run-of-mine (ROM) production FY21 was 20.7Mt, Managed coal sales were 19.8Mt. The company sells coal about 20Mt each year. The production and sales look stable for at least 5 years even with COVID-19 and bushfires, and floods. So, the average sales of coal are about 20Mt/year = 55kt/day. The gross profit a day would be 55kt*(212USD/0.719-74)= A$12.1 million a day. They are getting 12.1 m/1.03 b = $0.0117 per share a day. If I assume 55kt*(120USD/0.719-74)= A$5.11 million a day. They are getting 5.13 m/1.03 b = $0.005 per share a day. The net debt is 808.5m at the end of FY21, 67 days just needed to pay them all with the current 212USD/ton level. Now it is a level of 150USD/ton, even with this high rate of coal price, it takes some time for WHC to pay off the debts.
FY20 sales = 17.2Mt*(66/0.67)+3.0Mt*(89/0.67)=1694m+398m=2092m
FY21 sales = 17.2Mt*(68/0.74)+2.6 Mt*(85/0.74)=1580m+298m=1878m
Somehow, I am off for about 371m and 321m from Revenues, why? I need to revise here again.
FY21 profit = 17.2Mt*(68/0.74-74)+2.6Mt*(85/0.74-74)=308m+106m=412m, this is also different from EBITDA or NPAT. Maybe I need to understand the account better. I will update these later.
(***) I see the inconsistency of the cost of coal/ton or unit cost/ton (****) I might have missed but I could not find the number in financial reports from WHC.
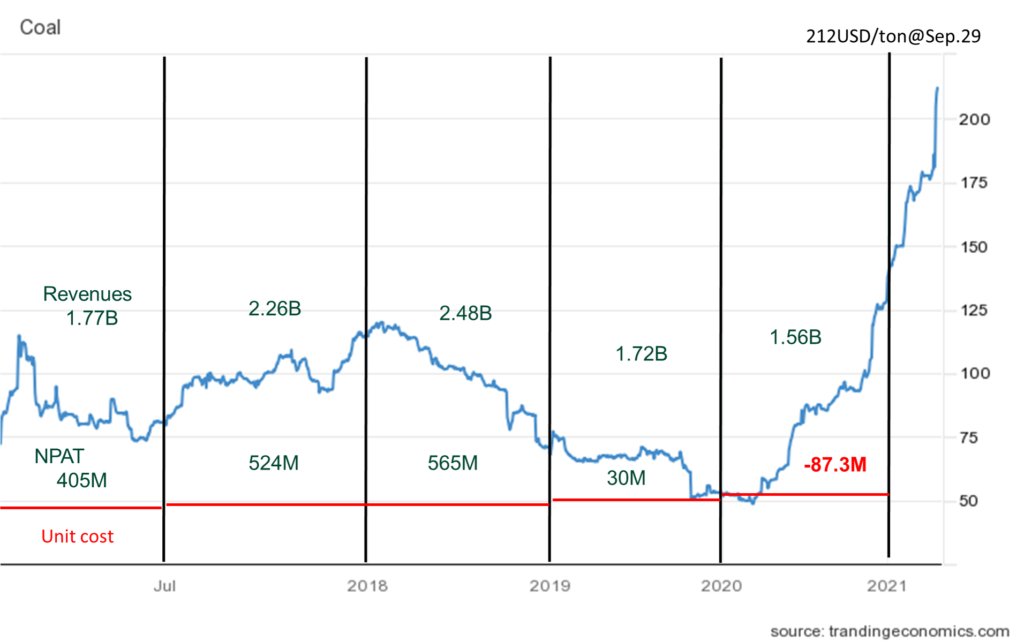
The data was taken from tradingeconomics.com. Sorry I didn’t have data itself so rough analysis. I put unit cost/ton level, NPAT, and Revenues. Now, we see WHC will enjoy the highest coal price last the 10 years. As long as I see it I will hold it until when the coal price goes down to 120USD/t level. As long as I can see it in the future today (November 2021), it will be until August 2022. As described in the last paragraph, at that level, the company keeps making money.
In the quarterly report on October 14th, 2021, the company said they will keep paying down their senior debt facility, they expect to repay the debt facility early in CY22 and be in the net cash position in March 2022 quarter. So hopefully, eventually the share price will be going up. The highest price in the last 5 years was A$5.89/share @July 6th, 2018. If the coal price is higher than 120 USD/t and keeps it there, they will break this price, I think…..